Diagnostics
Diagnostics is one of the 5 views of a terminal’s page in Nexus Telemetry Fleet. It shows whether traffic gets out from the site to the internet, stage by stage, so that a fault at the site can be told from a fault with Starlink. It also shows what the terminal reports about itself.
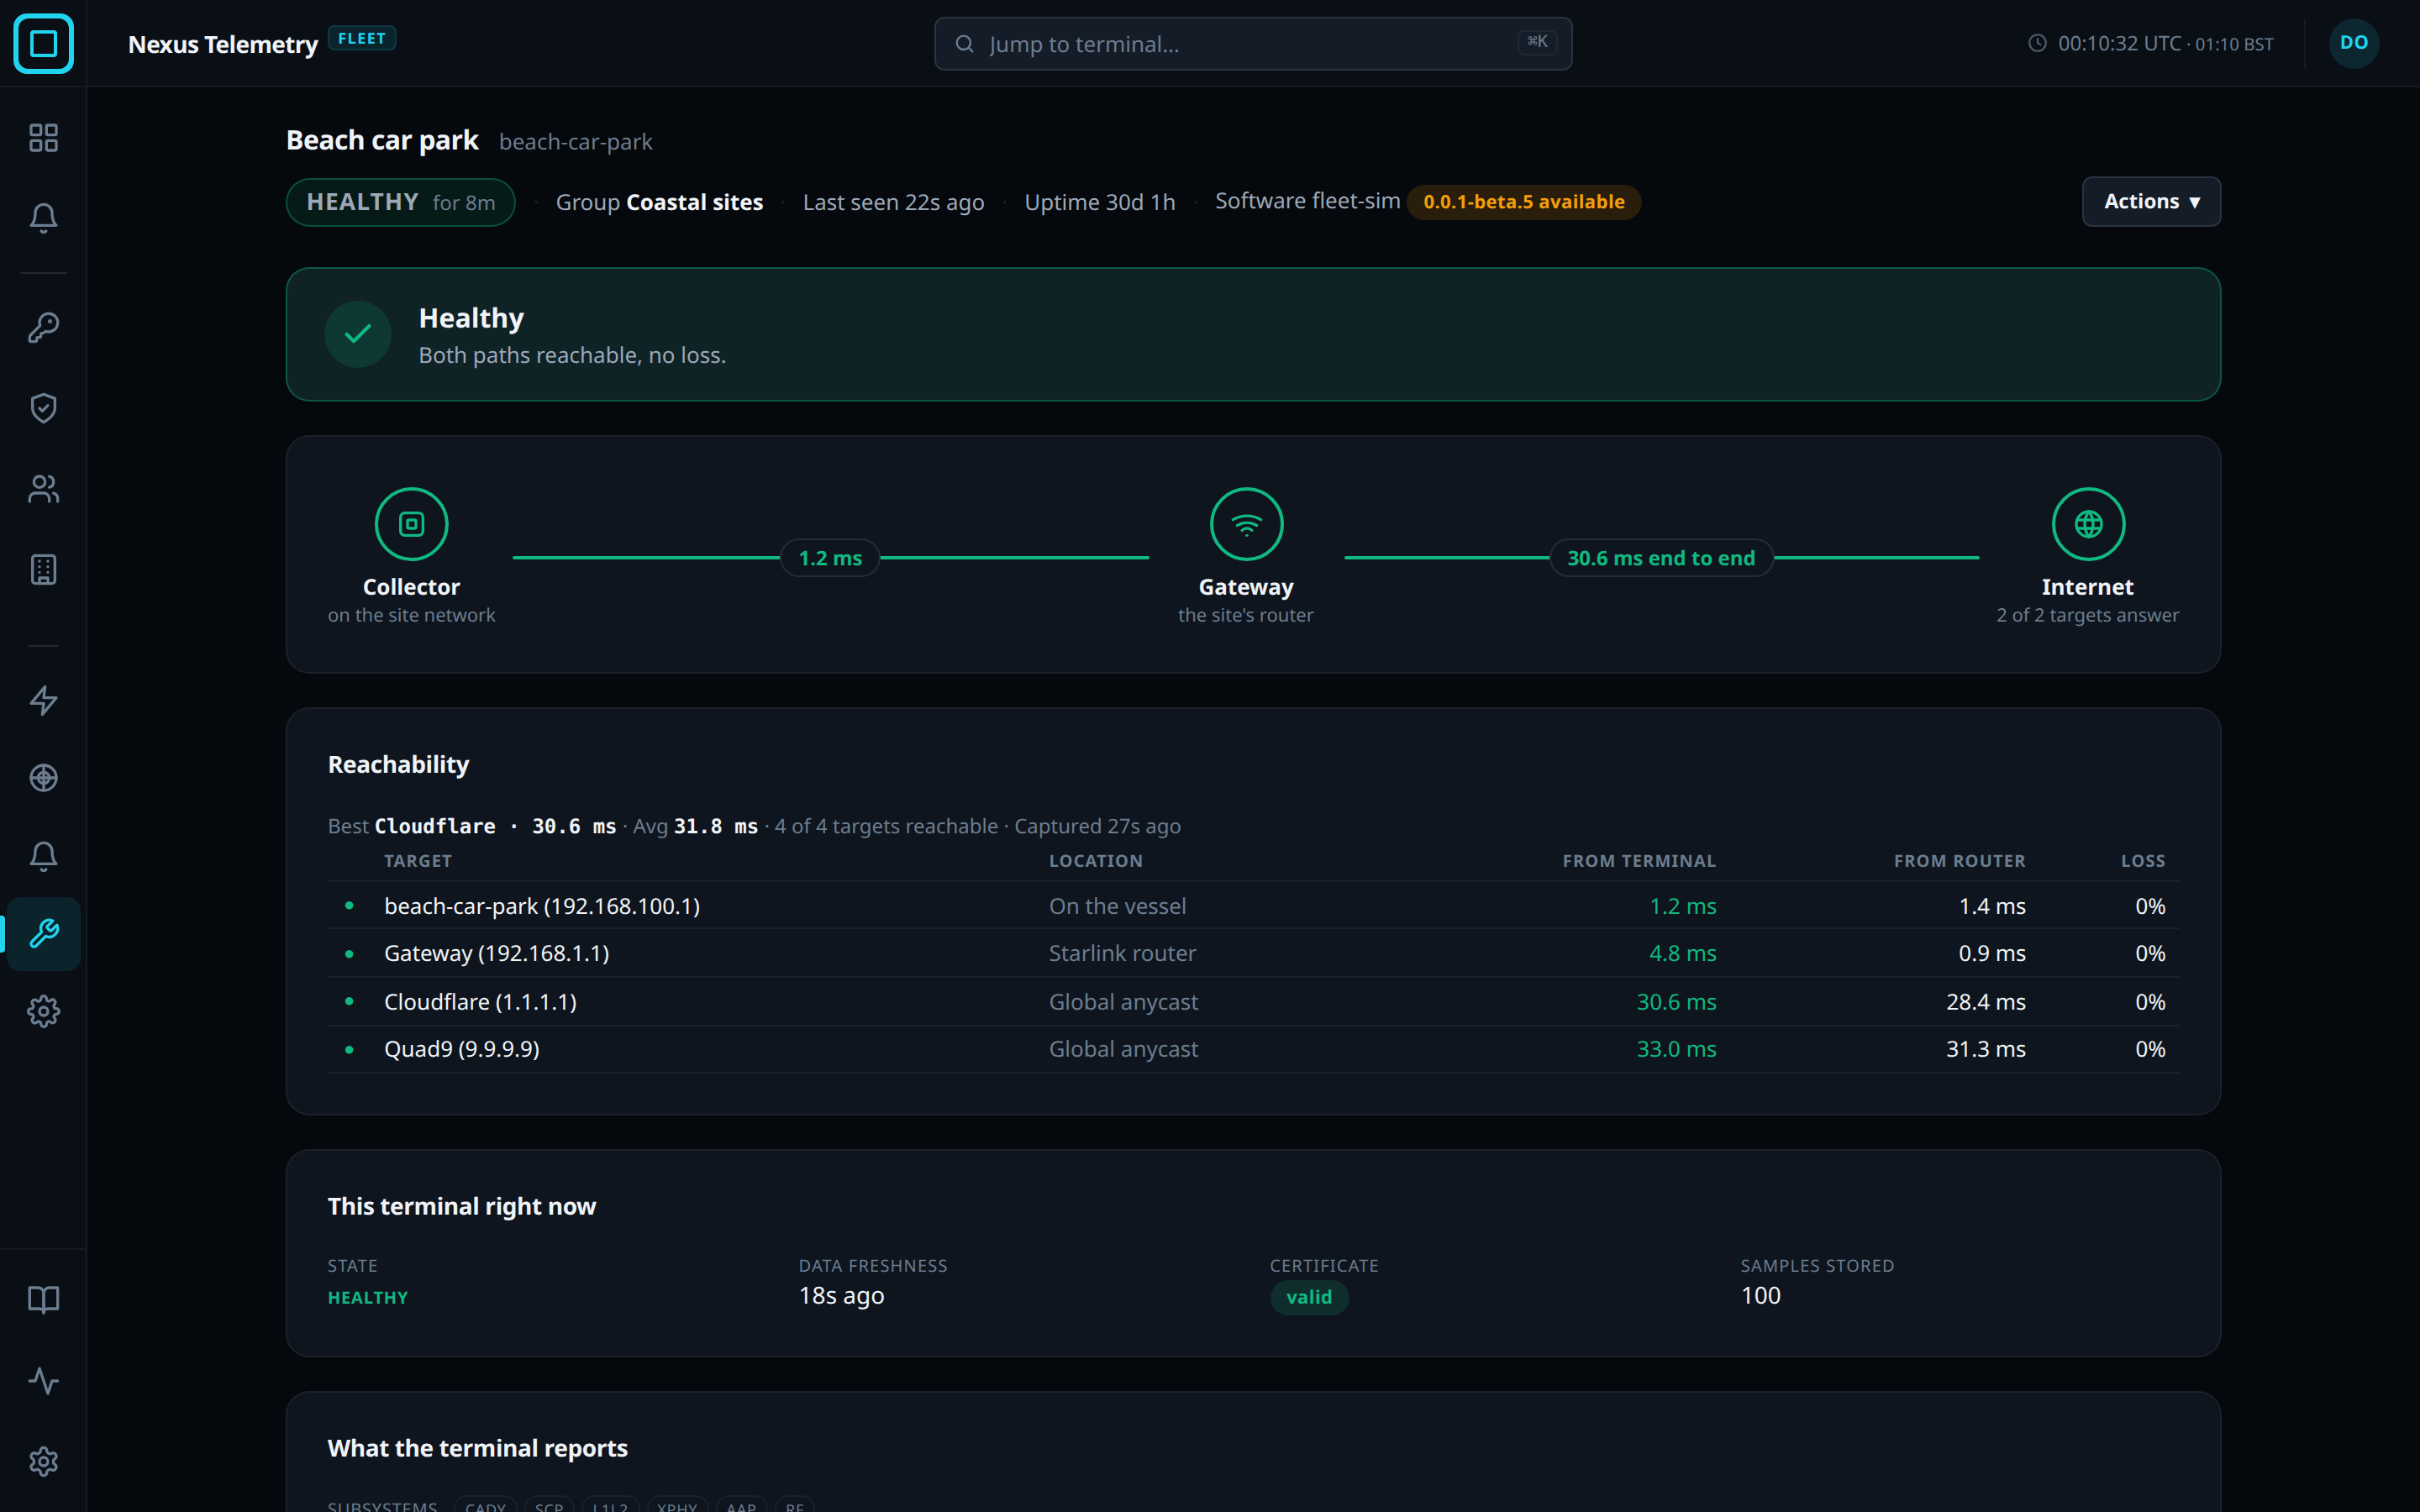
Reachability stages
The collector tests whether a set of addresses, from the terminal out to the internet, can be reached. Targets are added under Connectivity checks on the dashboard’s Settings page. The result is shown as a path of 3 stages, Collector, Gateway, the site’s router, and Internet, with a reading on each step of the path.
| Step | Reads |
|---|---|
| Collector to Gateway | The best time to a local address, in milliseconds. no answer when no local address replied. not measured when none was tested |
| Gateway to Internet | The best time to a target, as N ms end to end. no answer when no target replied and the local addresses did. unknown from the site when the site’s own network is down, so nothing beyond it can be tested |
| Internet | N of M targets answer |
Before the first test the view reads No reachability sweep recorded yet.
The Reachability table lists every target with the time to reach it from the terminal, the time from the Starlink router when that comparison is on, and the Loss, the share of test packets that got no reply.
Terminal status
This terminal right now gives the terminal’s State, its Data freshness, its Certificate status, and the Samples stored for the terminal on the fleet server. Terminal alerts lists the alert flags the terminal itself reports, and What the terminal reports gives the terminal’s own status, both as the terminal reports them.