Views and filters
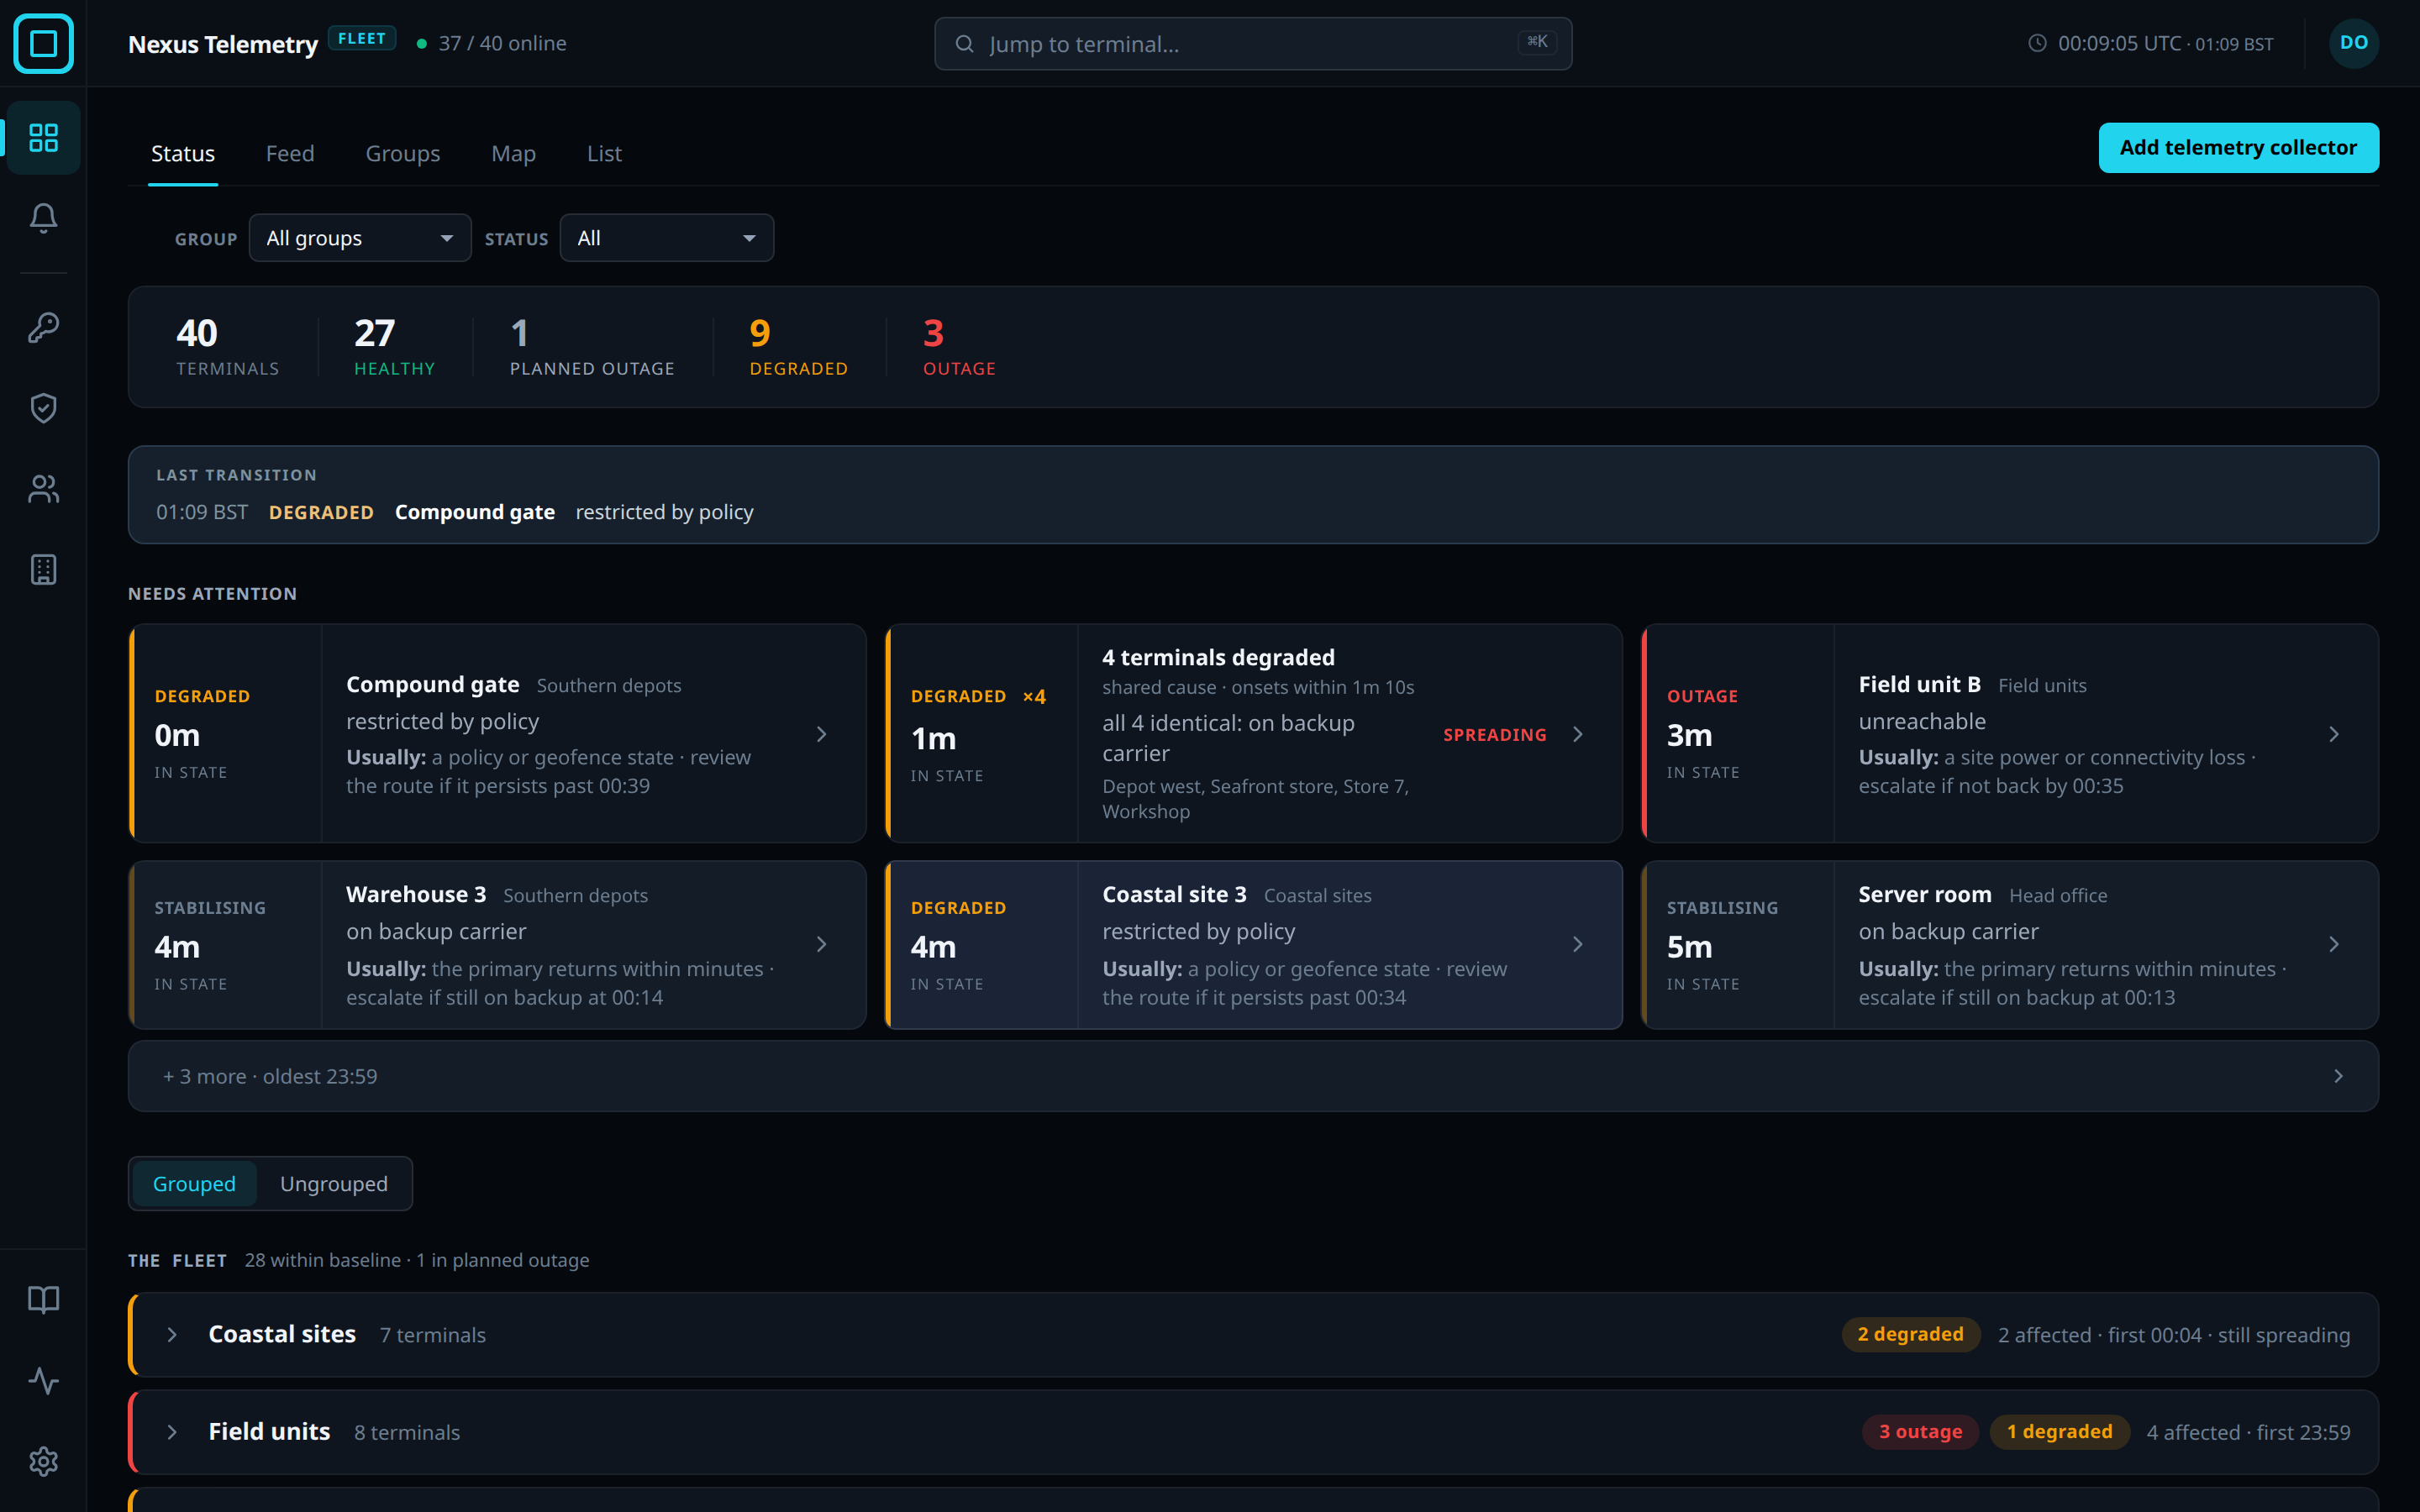
The Nexus Telemetry Fleet dashboard has 5 views of the fleet: Status, Feed, Groups, Map and List. Status is the default. The icon rail opens the other pages. Filters and search narrow every view but Groups.
Icon rail
Each icon has a tooltip with its name. Every icon but Docs has a number key.
| Icon, from the top | Opens | Shown to |
|---|---|---|
| Dashboard | The 5 views | Every user |
| Alerts | The alerts raised and the paused windows | Owner and Admin |
| Tokens | Enrolment tokens | Owner and Admin |
| Certificates | Certificates and the root key | Every user |
| Users | Accounts and roles | Owner and Admin |
| Organisations | The organisation tree | Owner and Admin |
| Docs (foot) | This documentation, in a new tab | Every user |
| Server health (foot) | The fleet server’s own health | The platform organisation |
| Settings (foot) | The Settings page | Every user |
Owner, Admin, Operator and Viewer are the roles. See Users and roles.
While a terminal’s page is open, the rail also lists that terminal’s own views. See Terminal settings.
Top bar
| Item | Meaning |
|---|---|
N / M online |
N of the fleet’s M terminals are up, meaning not in a confirmed outage. The Group filter narrows the count and the Status filter does not. It refreshes every 2 seconds |
| Jump to terminal… | Opens the search palette |
| Update available: | A newer release of the fleet server is published on its channel. See Server updates |
| Licence chip | Shown only when the licence requires attention, for example near its expiry. See Licensing |
| Clock | The fleet server’s time, in UTC |
| Initials | Open Account and Sign out |
Status
The count strip counts the fleet by state: Terminals, Healthy, Planned outage, Warning, Degraded and Outage. A state with no terminals is not shown.
Last transition is the most recent change of state by any terminal in the fleet. Needs attention is one card per terminal in trouble, newest change first, and one card for 3 or more terminals that share a cause. 6 cards are shown and the rest are folded. With every terminal healthy, the heading and the cards are not shown. See Attention cards.
The fleet is one named tile per terminal, coloured by state, or one square per terminal above 120 terminals. Once groups exist, a Grouped / Ungrouped switch arranges them by group or as one set. The browser remembers the switch. A terminal on any view opens its panel, and Open terminal on the panel opens the terminal’s page.
Feed
Feed lists the last 48 hours of state changes and user actions, newest first, under a header for each day. An outage and its recovery are one row: the row that reported the outage later reads ✓ recovered. Hovering a row shows 4 shortcuts, Live view, Show on map, Alert history and Terminal settings.
Groups
Groups is one card per group, worst first. Each card shows the state of the group’s worst member. See Groups.
Map
Map shows every terminal that has reported a position. The side panel counts the fleet as All, Healthy, Warning, Degraded, Outage, Planned outage and No fix, and each count but No fix is a filter. Terminals without a position are listed under N without a location, with those needing attention first.
List
List is the inventory: State, Terminal, Group, Cert, Version and Last seen. Click State, Terminal, Group or Last seen to sort. The list does not re-sort on its own. Hovering a row shows the same 4 shortcuts as the Feed at its end: Live view, Show on map, Alert history and Terminal settings.
Filters
| View | Filters | Effect |
|---|---|---|
| Status | Group, Status | Group narrows everything, the count strip included. Status narrows the cards and the fleet wall, not the count strip |
| Feed | Group, Show | Show is All, Faults, Recoveries, Lifecycle or Operator |
| Groups | none | |
| Map | Group, Status | Narrows the markers and the side panel |
| List | Group, Status, a name box | The name box narrows the rows as it is typed |
Status offers All, Outage, Degraded, Warning, Planned outage and Healthy. Feed, Map and List add Provisioning. A fleet server with more than one organisation adds an Account filter to the same three views.
Search palette
Open the palette with Jump to terminal…, or with cmd+K, ctrl+K or /
when no field has focus. Typing lists matches under Terminals, Groups,
Pages and Commands. The arrow keys move the highlight, Enter opens
the highlighted item and Escape closes the palette.
Change theme… in the palette offers Theme: dark, Theme: light and Theme: system.
The number keys 1 to 9 open items by position. On a terminal’s page they open that terminal’s views. On Settings they open its sections. Anywhere else they open the icon rail’s pages.
Maintenance banner
A notice posted under Maintenance notice on the Settings page announces a maintenance period for the fleet server. It is shown as a banner on every view from 7 days before the period, is red during the period, and clears when the period ends.