Server health
Server health reports on the Nexus Telemetry Fleet server itself: whether anything is wrong with it now, and how much more load it can take. It is opened from the icon rail. Only users in the platform organisation can open it. The platform organisation is the one created at the fleet server’s first run, and it manages the fleet server. See Organisations.
Headline
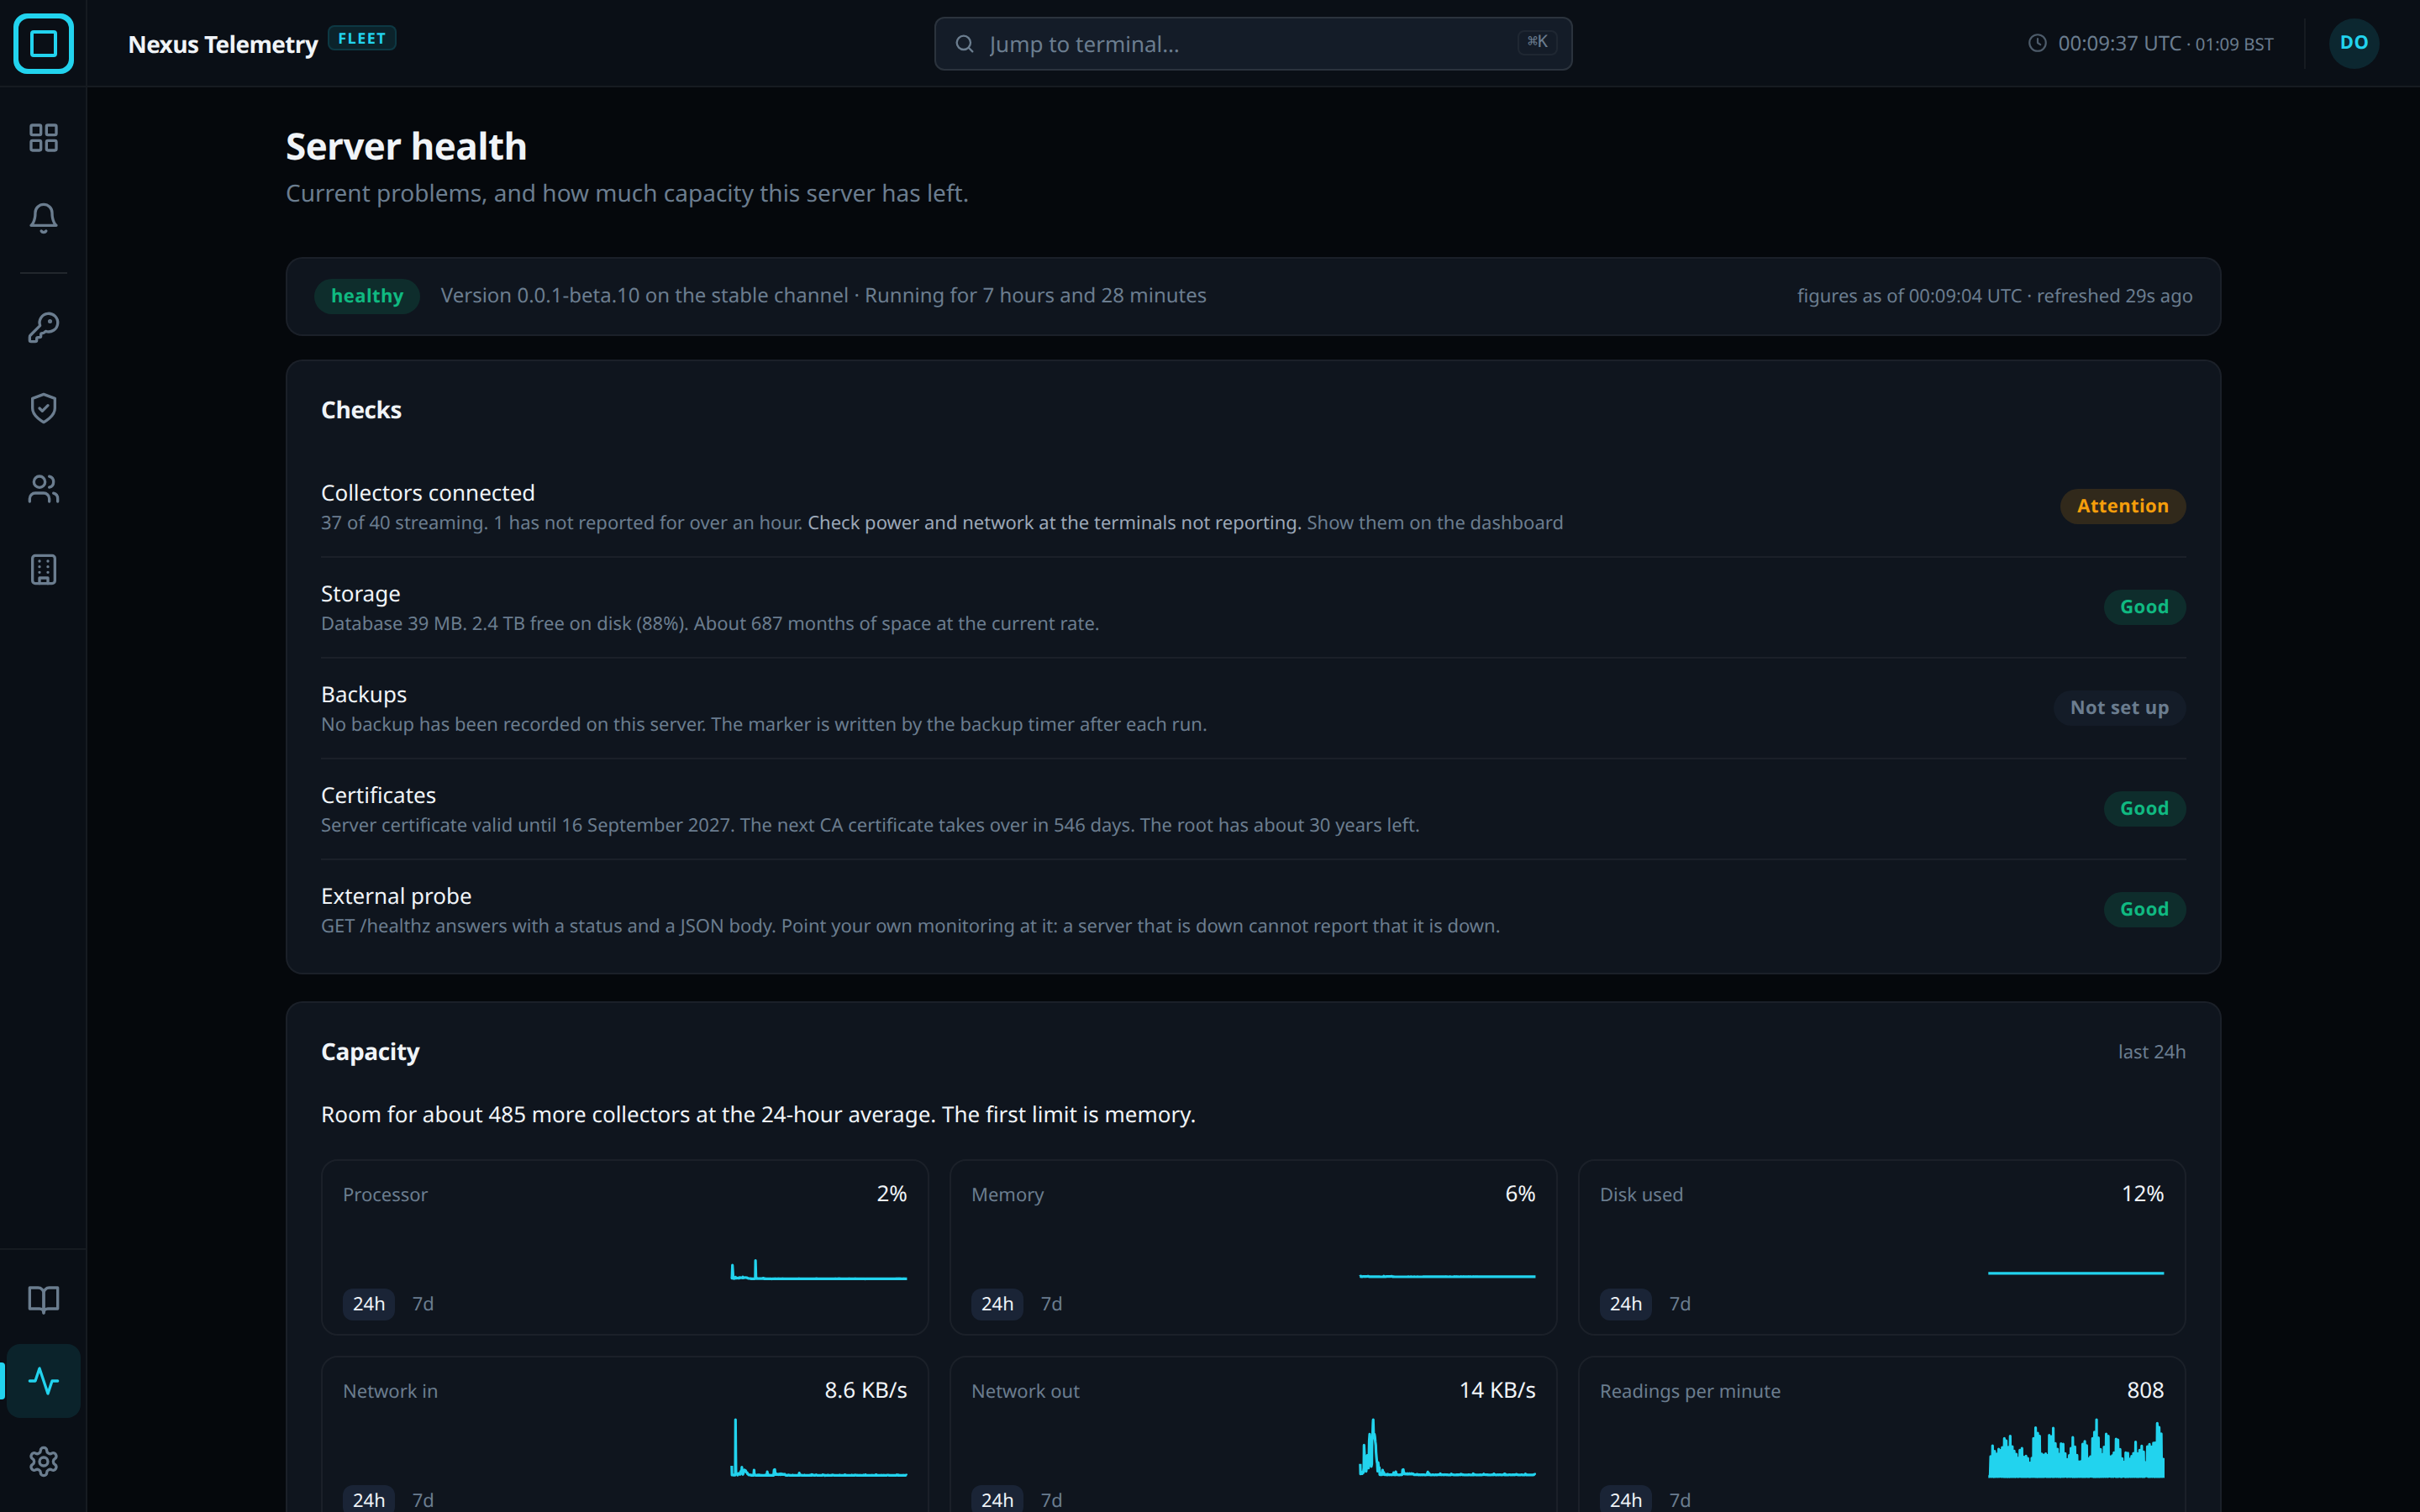
The page header gives the fleet server’s status, healthy or degraded, its Version with the release channel, and how long it has been running. figures as of gives the time the figures on the page were taken, in UTC. The figures are taken every 30 seconds.
Checks
Each check has one sentence and a badge. Good, Attention and Problem grade the check. Not known means the check could not be made, Not set up means the feature is not configured, and None yet means nothing has happened to check. Where there is something to do, the sentence says what, for example Check power and network at the terminals not reporting. for collectors that have stopped reporting.
| Check | Reports |
|---|---|
| Collectors connected | How many collectors are connected, how many are enrolled, and how many have not reported for over an hour. Show them on the dashboard filters the dashboard to the collectors in outage |
| Storage | The database size, the free disk space and its percentage, and how long the free space lasts at the current rate of use |
| Backups | How long ago the last backup ran, or that no backup has run on this fleet server. A backup older than NF_BACKUP_MAX_AGE_HOURS, 26 hours by default, is marked |
| Certificates | How long the fleet server’s certificate is valid, when the next CA certificate takes over, and how long the root certificate has left |
| External probe | That GET /healthz answers with a status. With NF_PROBE_TOKEN sent as a bearer token it answers with the full JSON body. This is the address for monitoring from outside. See Server configuration |
Capacity
Capacity (last 24h) says how many more collectors the fleet server has room for at the last day’s average load, and which resource runs out first. Processor, Memory, Disk used, Network in, Network out and Readings per minute each give their latest value and a line over 24 hours or 7 days. Retention gives each data tier’s size and its projection. Database size by organisation lists the 10 largest organisations’ shares, largest first.
Degraded status
The fleet server reports degraded in 2 cases only: its database is not
responding, or the pass that summarises readings has not finished for 3 hours. The
reason is given with the status. A check at Attention or Problem does
not by itself make the fleet server degraded. Collectors that stop reporting
are a problem in the fleet, not in the fleet server. GET /healthz answers
200 while the fleet server is healthy and 503 while it is degraded.
Measurement limits
A figure the fleet server’s host does not expose reads Not recorded on this host. rather than zero. The page measures the fleet server, not the network path to it, and a fleet server that is down cannot report that it is down. Monitoring from outside the fleet server’s network is what reports that. See Hardening.