Onboard status page
The collector serves the onboard status page on the site network so that anyone there can see where a connection problem lies: on their own device, on the site network, or on the Starlink connection to the internet. The page is served on port 9210 and stays available while the internet connection is down. It is off by default. A user turns it on from the terminal’s Admin view on the dashboard.
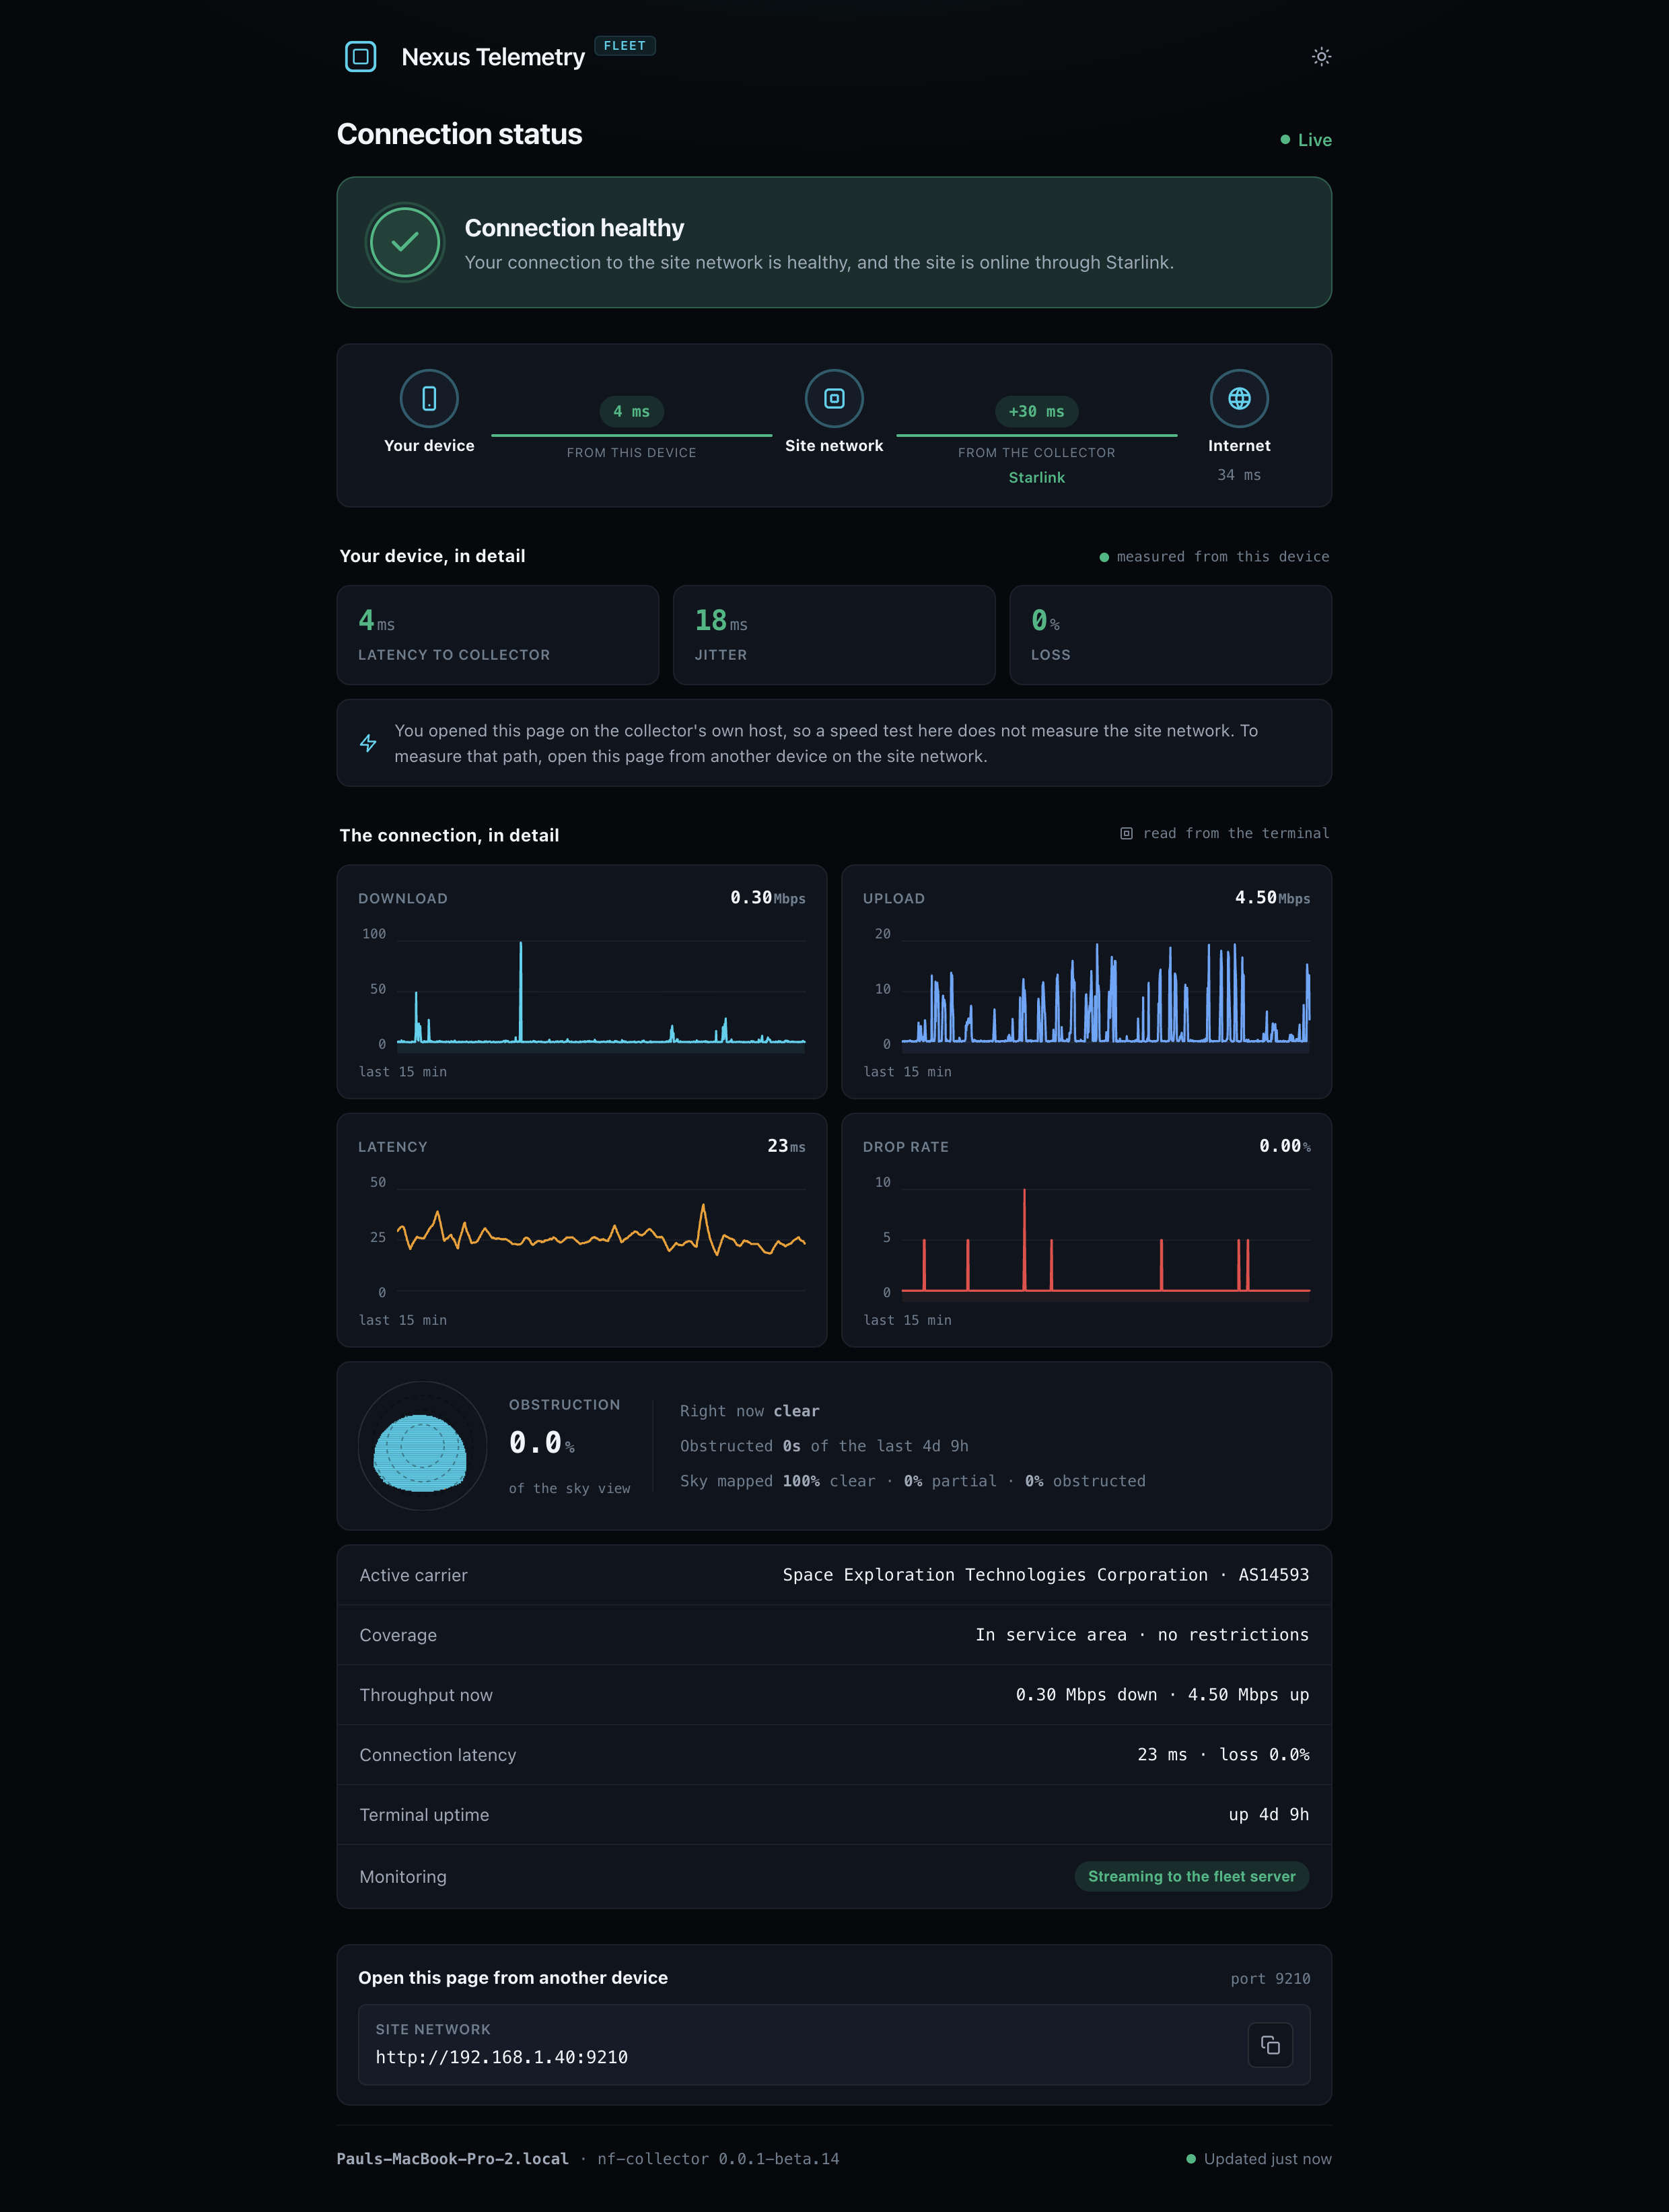
Connection stages
The page shows the connection in 3 stages: Your device, Site network and Internet. Each link between two stages shows its live latency and the source of the measurement. Each link is coloured by its state: green, amber, red, or grey when there is no recent reading. An Internet stage that cannot be reached is crossed out.
Detail panels
Two panels hold the measurements behind the stages. A row the collector cannot fill is left out. A trend with no readings keeps its card, marked empty.
| Panel | Measured by | Contents |
|---|---|---|
| Your device, in detail | The browser, measured from this device | Latency to collector, Jitter, Loss, and a Test speed button that measures this device against the collector. Opened on the collector’s own host, the page says so in place of the test |
| The connection, in detail | The collector, read from the terminal | 15-minute trends for Download, Upload, Latency and Drop rate, an Obstruction card with the sky view, then Active carrier, Coverage, Starlink reason, Throughput now, Connection latency, Terminal uptime, Terminal alerts, Last online and Monitoring |
Monitoring states what the collector observes. It does not report whether an alert was delivered.
Opened on the collector’s own host, the page also shows an Open this page from another device card: one tile per site-network address, each with a copy button, and the port. Loopback and virtual interfaces are left out.
Connection states
| State | Colour | Meaning |
|---|---|---|
| Connection healthy | green | This device reaches the site network, and the site is online through Starlink |
| Online on the backup connection | amber | Starlink is down, and the site is on its backup connection |
| Site connection down | red | Starlink is down, or Starlink and the backup are both down. The page still loads because it runs on the site network |
| Problem likely on your device | amber | The site is online. The problem is between this device and the site network, such as a weak Wi-Fi signal |
| No recent reading from the connection | amber | The collector has not read the connection recently. The page shows the last known state |
Enabling the page
- Open the terminal’s Admin view.
- In the Onboard status page section, turn on Status page on the site’s network.
The change applies without a confirmation or a restart. A connected collector applies it immediately. An offline collector applies it when it next connects. The change is recorded in the collector’s Event History. A user with the Viewer role sees the setting as read-only. See Users and roles for the roles.
NF_LOCAL_STATUS set on the collector overrides the dashboard setting. While
it is set, the collector keeps its own setting. The dashboard keeps showing
the fleet server’s setting, which the collector records and does not
apply. Removing the override requires a collector restart before the fleet
server’s setting takes effect.
| Value | Effect |
|---|---|
1, true, on or yes |
On, on every interface |
0, false, off or empty |
Off |
address:port |
On, on that interface and port only |
| anything else | Off. The collector logs that the setting is invalid and serves no page |
See Collector configuration for every other collector setting.
Network access
Access is restricted to the site network. The page accepts requests from
private addresses and refuses all others with a 403 and the message This page
is only available on the site network. The restriction uses the source address
of the request, so a forged X-Forwarded-For header has no effect.
The page is read-only. It shows no credentials and has no control over the
collector or the fleet server. It is served over plain http://, so a browser labels
it “not secure”.