Attention cards
Attention cards are the cards under Needs attention on the Status view of the Nexus Telemetry Fleet dashboard. There is one card per terminal in the Warning, Degraded or Outage state, ordered by onset, newest first. A card names the terminal, its state, how long it has been in that state, the cause, and the usual explanation for that cause under Usually:. With every terminal healthy, there are no cards. A card leaves when the terminal’s state is no longer one of the three. There is no dismiss.
The first 6 cards are shown in full. The rest are collapsed into one line that counts them and gives the oldest onset.
A card in the Stabilising state is a terminal whose recovery is being confirmed. An incident card marked Spreading has its newest onset under 3 minutes old.
Incidents
3 or more terminals with the same cause and onsets close together become one incident card, marked with the count. It lists the member terminals. Clicking it opens the incident panel, with the members on the left and one terminal’s detail on the right. When the terminals no longer share the cause, the incident ends with This incident has ended. Its terminals now appear individually above.
Terminal panel
Click a card to open the terminal’s panel over the Status view.
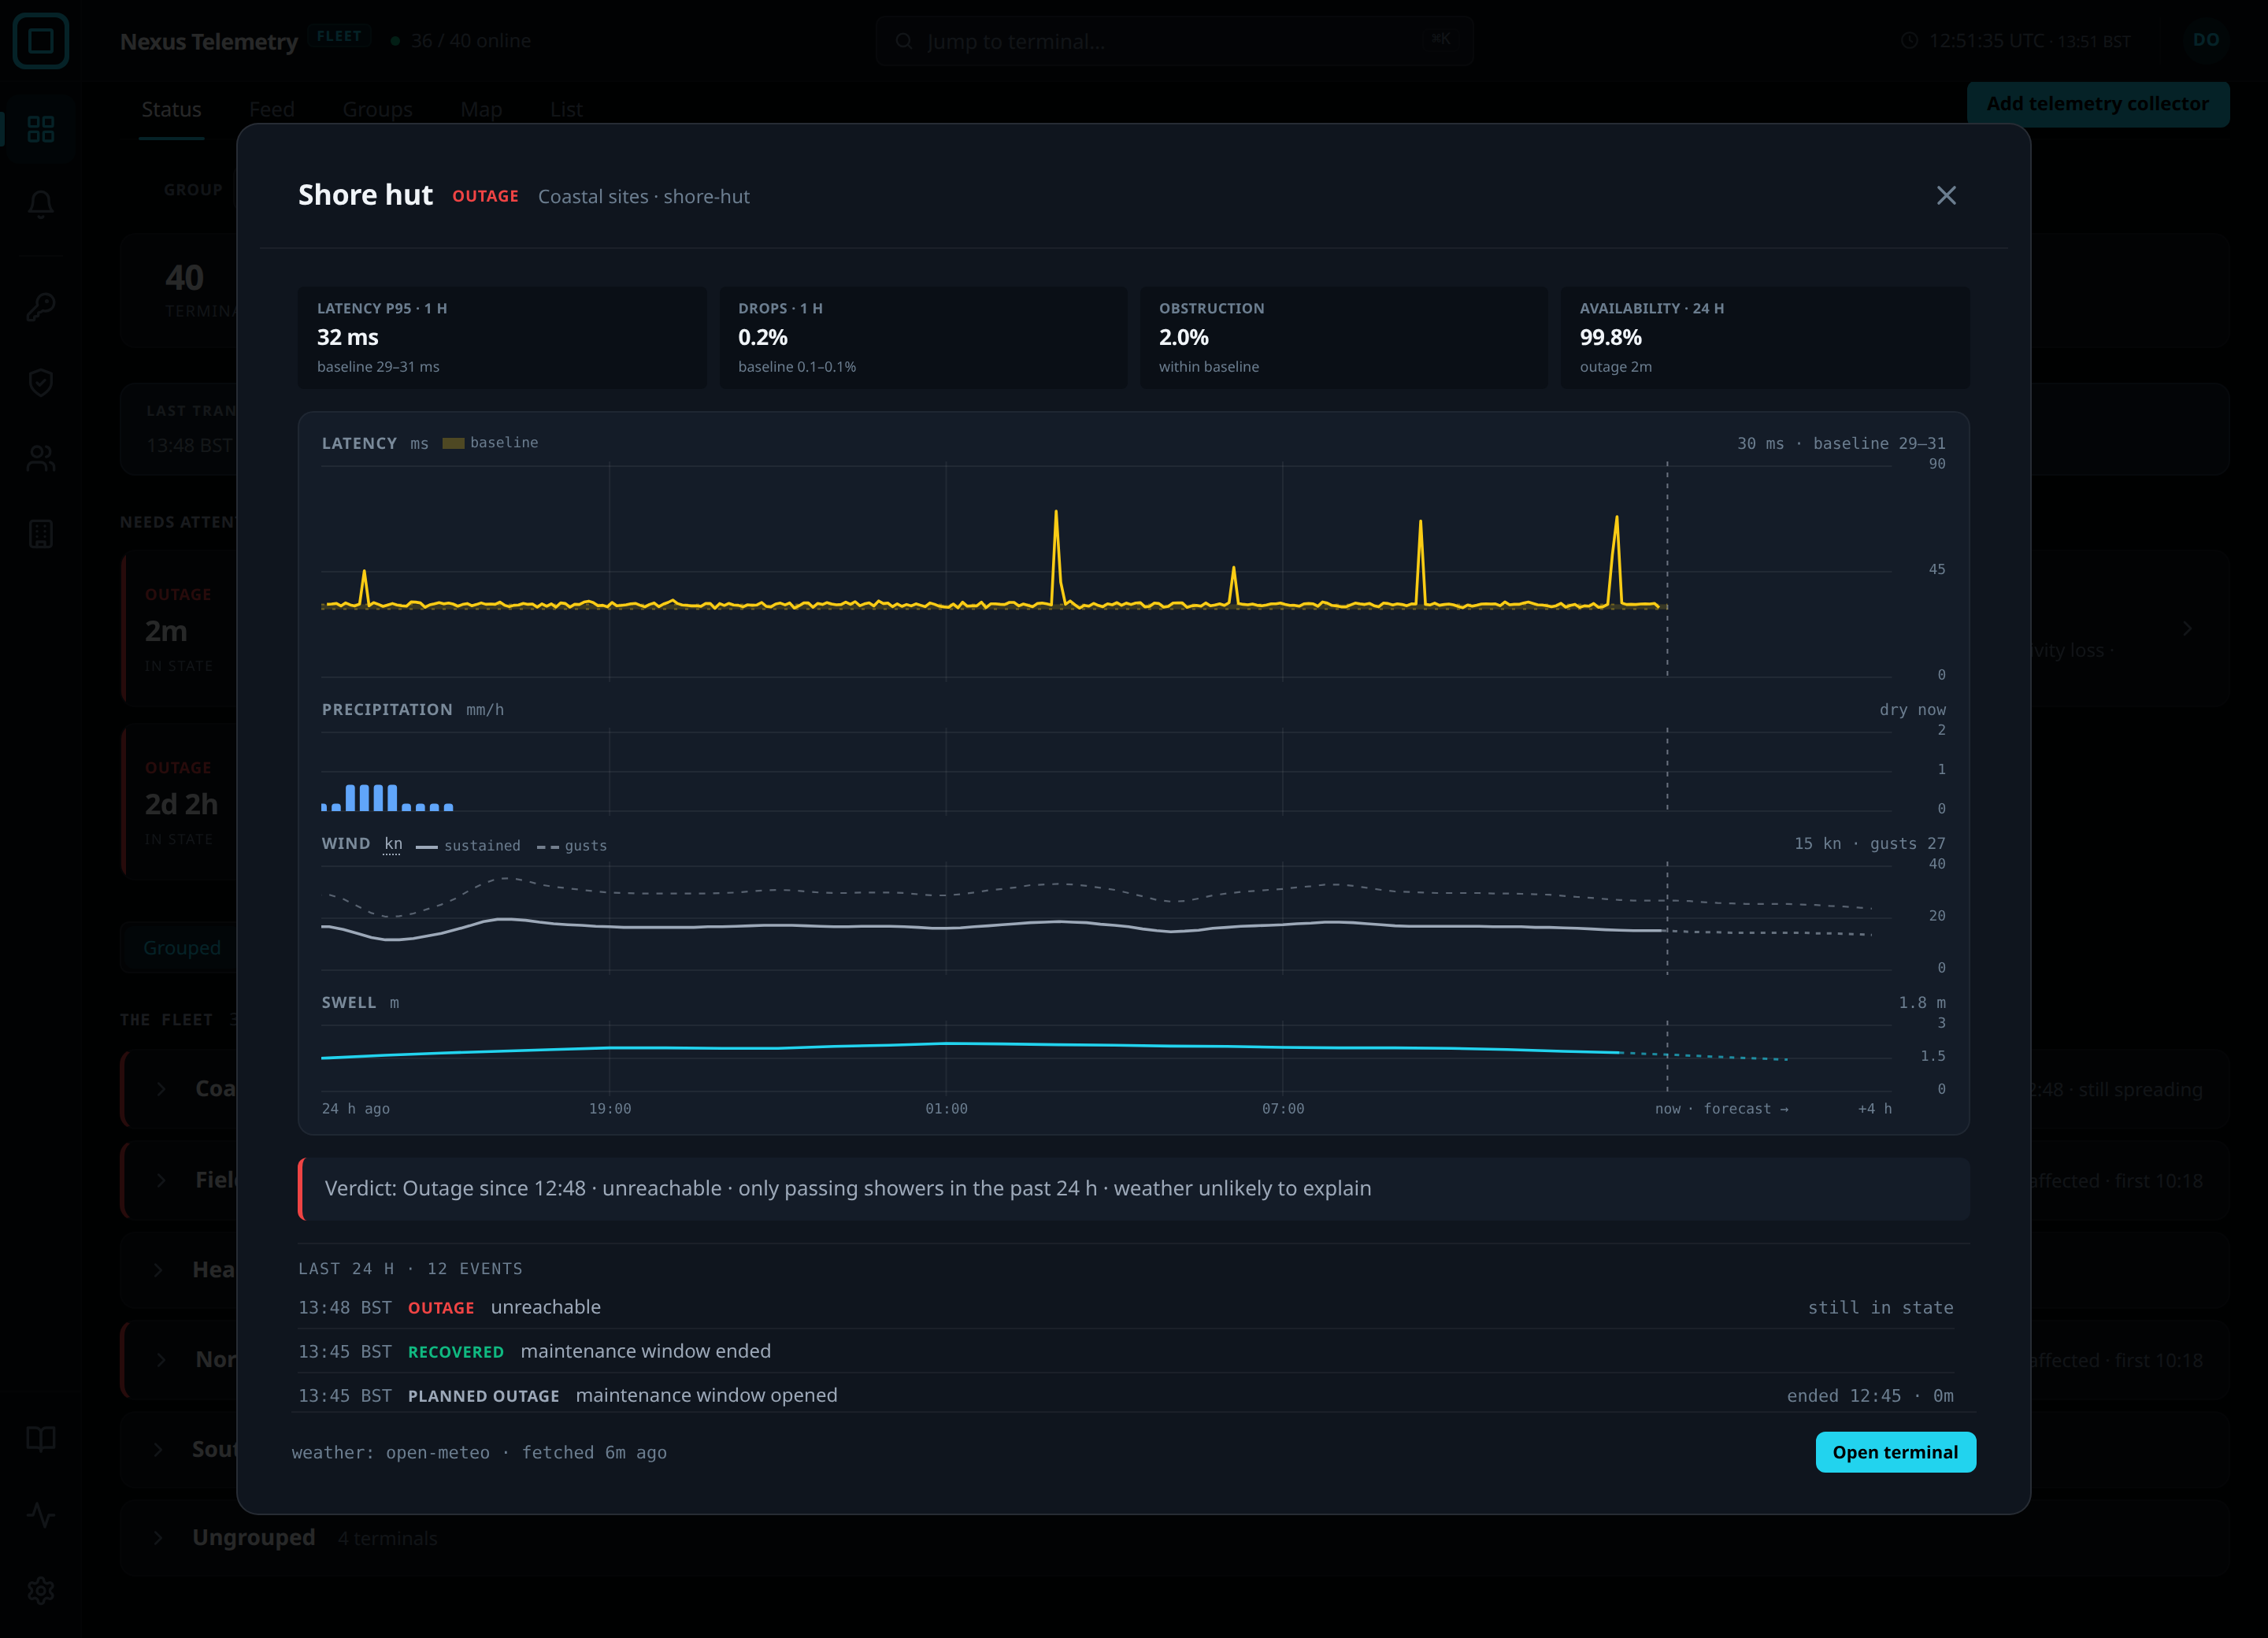
A baseline is what is normal for that terminal, learned from its recent readings. See States for the states and causes.
| Part | Shows |
|---|---|
| State line | The state, since when, and the cause: unreachable, on backup carrier, restricted by policy, latency above baseline, drop rate above baseline, a maintenance window overrun, or stopped at the terminal. After a fleet server restart the list shows server restarted · reconnecting and then reconnected after the server restart for every terminal |
| Availability · 24 h | The terminal’s up time over the last day |
| Latency p95 · 1 h and Drops · 1 h | Latency and drop rate over the last hour, against the terminal’s baseline |
| Obstruction | The terminal’s sky obstruction: within baseline, or elevated |
| Latency chart | Latency over the last 24 hours against the baseline |
| Precipitation, Wind and Swell lanes | The weather at the terminal over the same 24 hours, with a 4-hour forecast to the right of the now line. Swell is shown for a terminal at sea level. The state line says whether the weather explains the fault. Requires the terminal’s position and NF_WEATHER on the fleet server. See Collector GPS and Server configuration |
| Last 24 h · N events | The terminal’s state changes over the last day, up to 20, each marked confirming, reverted, ended with its time and duration, or still in state |
Open terminal
Open terminal on the panel opens the terminal’s Live view, the telemetry streamed from its collector. From there the icon rail on the left opens the terminal’s Alerts, Diagnostics and Admin views, and Obstruction once the terminal has sent a sky map.