A fleet dashboard demos well long before it works well, so evaluate it with tests rather than screenshots. Five will tell you most of what you need, and each one takes minutes against a running system: pull a site’s uplink and see whether the gap fills in, restart a collector and see whether its buffered data survives, remove a device and see whether it actually stops reporting, ask what a day nobody could observe reads as in the report, and ask who is allowed to add a device to the fleet.
This guide is about how to run those tests and what a good answer looks like. It applies to commercial products, open source projects and anything built in-house, including ours.
Where do you run these tests?
On a trial, before you commit the fleet. Every serious option gives you a way to stand one up: a commercial product should offer a pilot, an open source project can be deployed against one or two real sites, and a vendor demo fleet works for everything except the restart test, which needs a site you control. One vessel or one remote site for a fortnight is enough to run all five, and it is a fraction of the cost of discovering the answers after rollout.
If a supplier cannot give you an environment where these tests can be run, or would rather talk you through slides than let you pull a cable, treat that as an answer in itself. A vendor confident in the behaviour underneath will let you try to break it.
Why has the number of fleet dashboards suddenly grown?
Because building one stopped being expensive. AI coding tools have cut the cost of a working dashboard from months to a weekend, and what comes out ranges from solid to hollow. Some are built by people who have run fleets and use the tools the way they use any other, with the output reviewed and understood. Others are prompted until they run. Both arrive looking the same, because a convincing interface is the part these tools produce most reliably, and a dashboard is mostly interface.
That is not an argument against them. Cheap, quick software is a real gain, and this field owes a debt to the open work that first documented how a terminal reports its own status. But the polish of a demo used to imply months of work behind it. Now it implies a weekend, and it tells you almost nothing about what is underneath. The tests below are how you find out for yourself, and none of them require reading anyone’s code.
What happens to the chart after an outage?
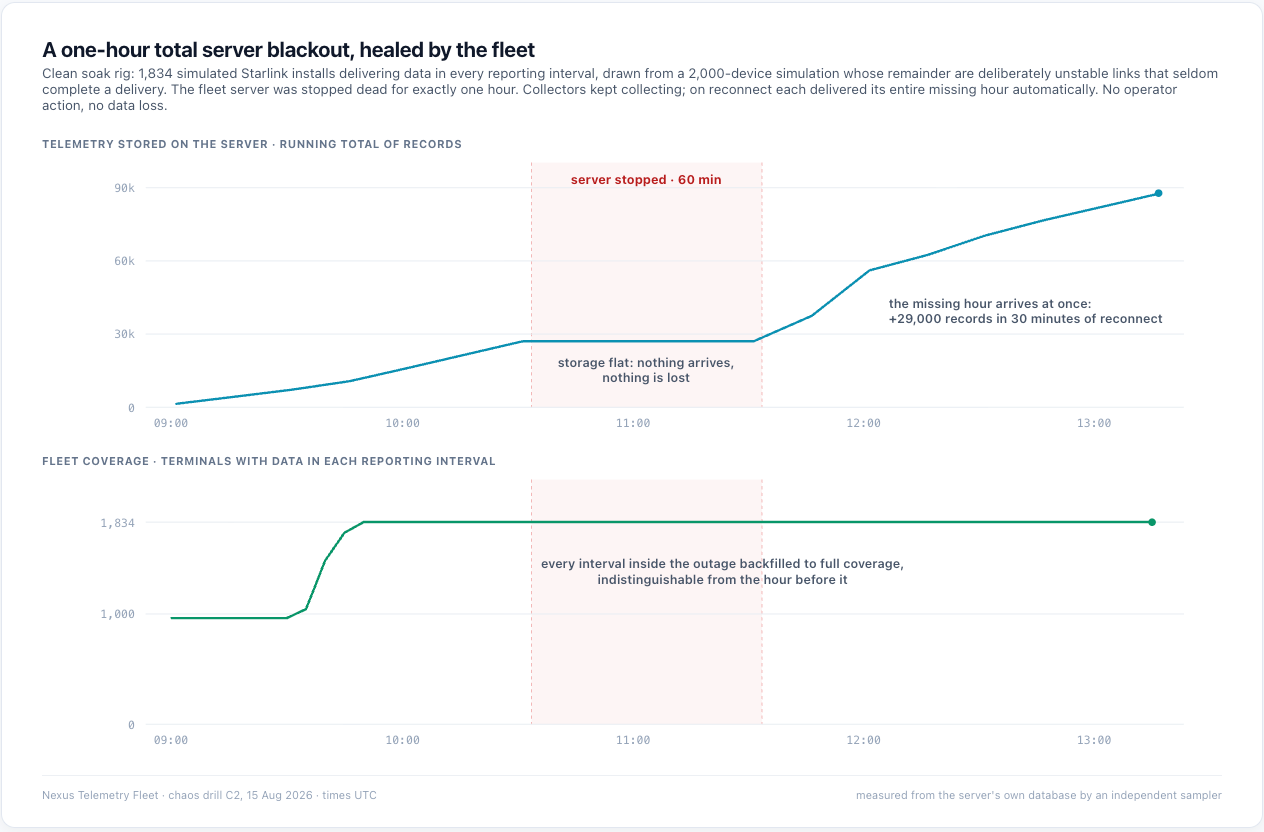
Take a site’s uplink away for an hour, restore it, and look at that site’s history for the period. You want the hour to fill in with what the terminal actually did. If the chart shows a permanent hole, the system only records what it can see at the moment it looks, which means every outage you most need to explain afterwards is the part it cannot tell you about.
This is the difference between polling a site from a cloud and collecting at the site itself. Local collection keeps recording through the outage and delivers the record when the path returns. Ask how far back that buffer stretches, too: a system that holds hours is fine for a fixed office and useless for a vessel that spends four days out of contact.
Does the buffer survive a restart?
Deliberately restart or update the software running at the site, then check whether the data it had buffered is still there. This is the test most likely to surprise you, because store-and-forward is easy to claim and easy to get wrong. If the buffer lives somewhere that is wiped when the process is replaced, the guarantee evaporates on the first update, and it evaporates silently.
Ask the vendor plainly: where does the buffered data live at the site, and what happens to it when the software is updated or the machine reboots? A good answer is specific about the location and confirms it persists. A vague answer usually means nobody has tested it.
Can you remove one device cleanly?
Remove a single device from the fleet and watch what happens to it. Two things should be true: it stops being able to report within moments rather than at some later refresh, and nothing else in the fleet is disturbed. Then try to bring it back, and see whether it returns as itself, with its history and its name intact, or arrives as a stranger.
This matters more than it sounds. Devices are lost, sites are decommissioned, and hardware gets replaced under warranty. A system where removal is cosmetic, or where a returning device orphans its own history, will make a mess of your records exactly when you are already dealing with a problem.
What does the report say about a day nobody could see?
Ask what a device that went dark for a day reads as in the availability report. If the answer is anything other than an explicit unobserved period, the tool is guessing, and it is guessing in your favour, which is the direction that loses arguments with customers. We set out why in What uptime actually means for a Starlink fleet: honest availability splits three ways, and a dark device is never a silent 100%.
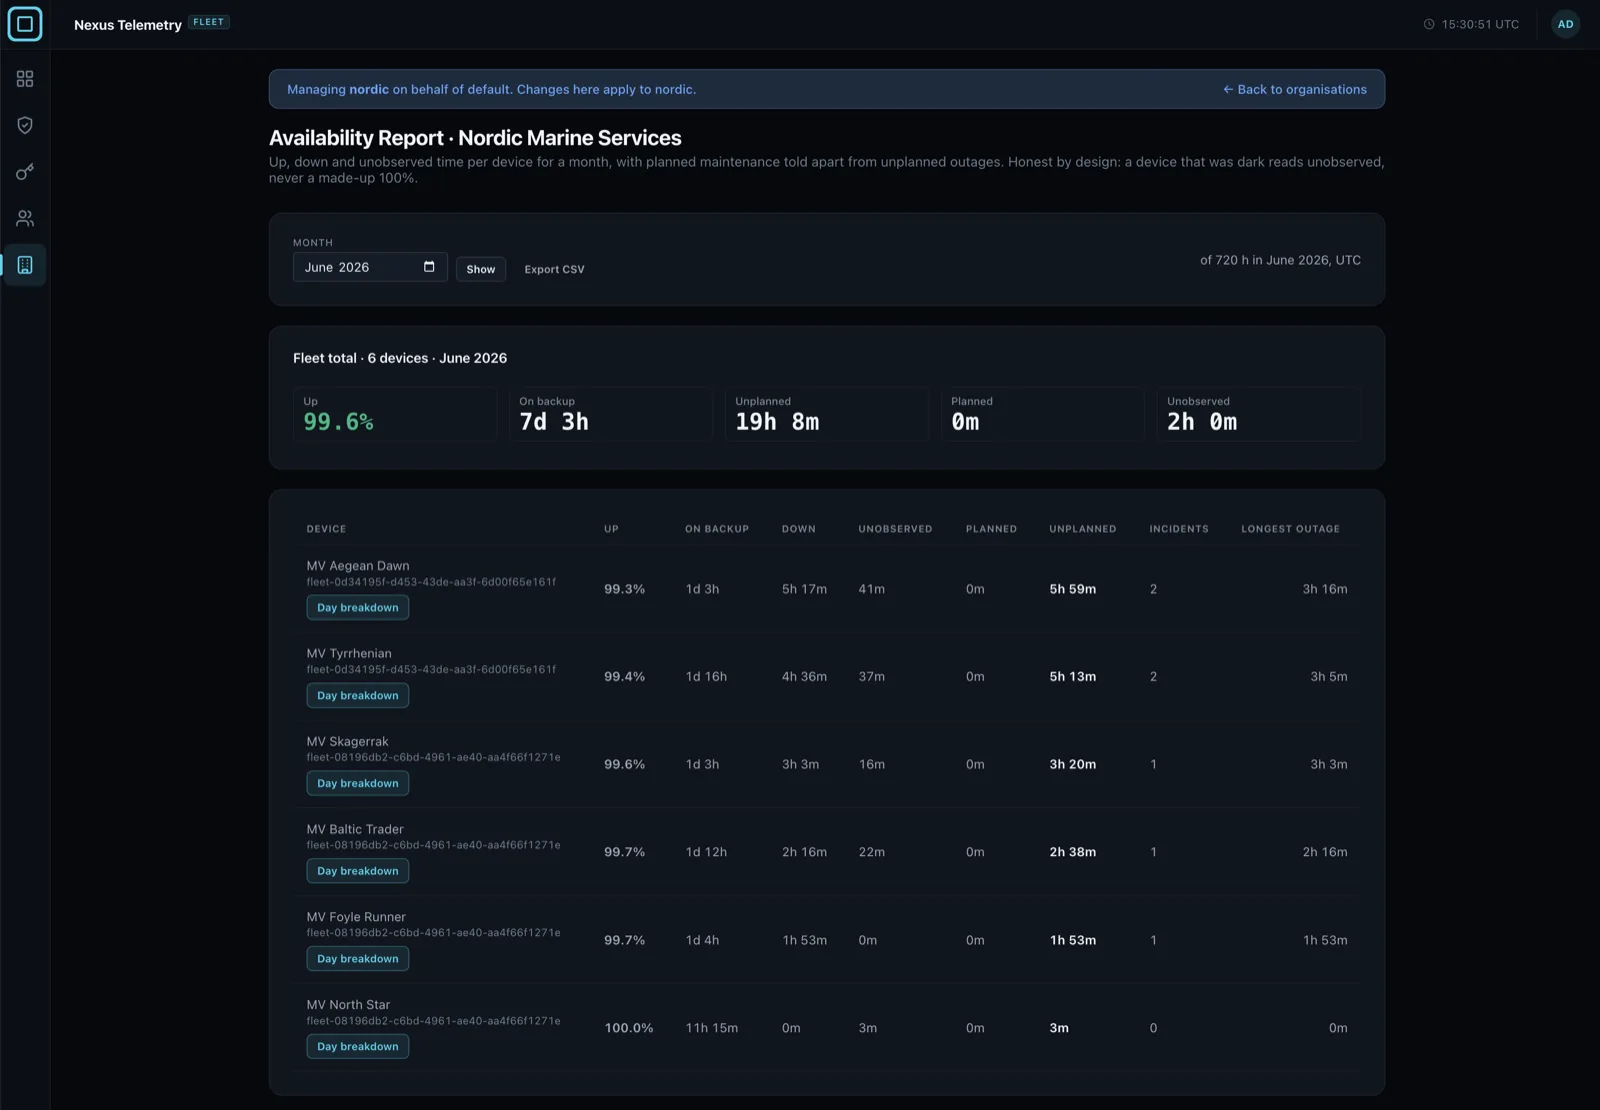
While you are there, ask whether planned maintenance can be separated from unplanned downtime without editing history, and whether time on a backup link is counted separately. Both are the difference between a report you can put in front of a customer and a number you have to defend.
Who is allowed to add a device to the fleet?
Ask what someone needs in order to enrol a new device, and what that credential lets them do afterwards. A fleet system’s device credentials are worth more than a single login: they decide what data enters your records. The questions to ask are simple. Does adding a device require an authenticated operator, or can anyone who can reach the service do it? Do the credentials expire and can they be revoked? And is the connection from site to server encrypted, or does that depend on how you deploy it?
Deployment matters here in a way that is worth understanding rather than fearing. Plenty of good self-hosted software expects you to put encryption in front of it, exactly as Grafana or similar tools do, and that is a reasonable division of labour. The question is whether the documentation tells you clearly, and whether the defaults are safe for someone who follows the quick-start and stops there.
What about self-hosting an open source option?
If you have the team for it, it is a legitimate choice. Open code can be inspected, you keep the data on your own infrastructure, and the five tests above are ones a capable engineer can run in an afternoon. We look at how to judge the projects themselves in open source Starlink fleet monitoring. Good projects deserve users, and they deserve contributors even more.
Be honest about the ongoing job, though. Self-hosting means you own patching, backups, uptime of the monitoring itself, and the answer at three in the morning when it stops alerting. Those costs are invisible until the person who set it up leaves, and a monitoring system nobody is maintaining is worse than none, because people trust it. The question is not open versus commercial. It is whether the accountability sits with your team or with a supplier, and which of those you would rather have when a customer disputes a month of connectivity.
That second reader is who Nexus Telemetry Fleet is built for: operators who need the record to hold up without running the platform themselves.
The short version
Judge a fleet system by behaviour, not by its dashboard. Run the five on a trial site before you commit the fleet. Pull an uplink and check the gap fills. Restart the site software and check the buffer survived. Remove a device and check it truly stops, then returns as itself. Ask what an unobservable day reads as in the report. Ask who can add a device and what that credential allows. Fleet software is quick to produce now, and nothing vets a dashboard before it reaches you; these five tests are the vetting. If you have the team to do it, the good open projects are worth using and worth joining. If you would rather that work sat with a supplier, buy from one who can answer all five without hesitating.
Part of Starlink Fleet Monitoring: The Complete Guide. Nexus Telemetry Fleet is built by Liquidbinary Ltd, the developers of one of the first Starlink Enterprise management platforms. Fleet is in early access: get started.